Hyde & Rugg:
We solve hard problems
Hyde & Rugg:
We solve hard problems
Likert scales, Likert-style scales, and visual analogue scales share the underlying principle of getting the participant to rate something using a scale. The scale may be verbal (e.g. strongly disagree, mildly disagree, neither disagree nor agree, mildly agree, strongly agree) or numeric (e.g. on a scale of 1 to 5, where 1 = agree a little and 5 = agree a lot) or purely visual (e.g. a horizontal line where one end corresponds with do not agree and the other end corresponds with completely agree).
There is an extensive literature about these approaches. Important issues when using any of these approaches include:
These choices affect the types of statistic which can be used to analyse the results.
Likert scales
Likert scales are named after Rensis Likert, who invented them in the early 1930s. They turn up in most questionnaires, usually in the form of response options such as:
1 Strongly agree
2 Weakly agree
3 Neither agree nor disagree
4 Weakly disagree
5 Strongly disagree
Another variant is the visual analogue Likert-style scale. This occurs in various forms. Here’s one form, from Wikipedia:
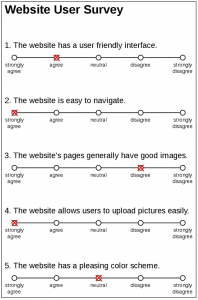
By Nicholas Smithvectorization: Own work – Own work, based on File:Example Likert Scale.jpg, CC BY-SA 3.0, https://commons.wikimedia.org/w/index.php?curid=18615046
Likert scales and Likert-style scales are widely used, because they give quantitative results into the strength and the distribution of people’s opinions on a topic. However, they are prone to various well-recognised problems relating to the choice of questions, wording of questions, choice of anchor points, choice of measurement range, and whether odd or even numbers of responses are used.
We find visual analogue scales preferable, because they give finer-grained measurements, and because they are less likely to encounter problems with human cognitive limitations than methods using numbered scales. They are still open to problems with choice of questions and choice of anchor points, so we prefer to use other methods first to find out which questions we should be asking, and which anchor points we should be using.
Visual analogue scales
Visual analogue scales are useful for quantifying people’s opinions about something; for example, how easy they think a product would be to use.
Advantages
Visual analogue scales are fast, easy to use, and give fine-grained measurements (e.g. a 100 point scale, compared with a 7 point scale for a typical Likert-style scale).
Disadvantages
The scales are only as good as the variables chosen as measurements, and as the anchor points used to define the meaning of the scale. It’s important to make sure you’re measuring the right things.
At a glance
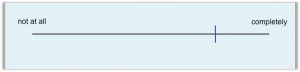
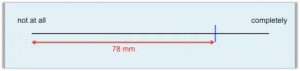
The image below shows a single question on a visual analogue scale, with the participant’s response shown via the blue vertical line through the black horizontal line.

Decide which variables you want to measure.
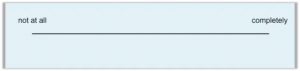
For each variable, design a question, and an accompanying scale, as in the example above.
Each question has a number (e.g. Q1).
The line is usually 100 mm long, but doesn’t have to be.
At each end of the horizontal line there is an anchor point (a phrase explaining what that end of the scale represents).

Give the participant a scale to fill in
Ask the participant to draw a vertical line through the scale at the point that corresponds to their answer to each question (the blue line in the image above).

After the participant has finished, measure their responses to each question, and collate them e.g. in a spreadsheet
Measure how far the vertical line is along the horizontal line (e.g. 87 millimetres from the left-hand anchor point)
This gives you a figure of 87 for their response to that question.
Analysis
You can use standard quantitative approaches to analyse the results.

This approach fits particularly well with iterative prototyping, where methods such as think-aloud let you identify the key variables. Then visual analogue scales let you measure improvements with each iteration, and identify when you reach diminishing returns and can proceed with your project.
Other methods that work well with visual analogue scales are observation, think-aloud, card sorts, and laddering, to identify the key attributes to measure with the visual analogue scales.
This approach also works well with liking and disliking scales, where you treat liking as one scale, and disliking as another. These give powerful insights into attitudes, especially when the attitudes are mixed and complex.