Hyde & Rugg:
We solve hard problems
Hyde & Rugg:
We solve hard problems
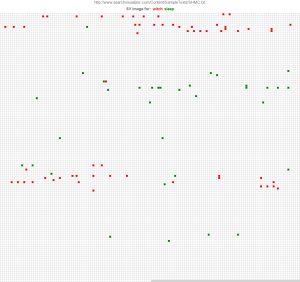
Search Visualiser (originally known in its first version as Search Visualizer) is a piece of software invented by Gordon Rugg and Ed de Quincey. It shows the distribution of chosen words or phrases within a text, as in the example opposite. Each different keyword or phrase is shown in a different colour, so the user can see where the keywords/phrases occur in relation to each other. The colours differ in greyscale values, for accessibility.
In the image opposite, each tiny white square represents a word. The square at the top left corresponds to the first word of the text being shown; the last square on the bottom row corresponds to the last word of the text. This makes it possible to show extremely long texts on a single computer screen, so the user can see distributions of words/phrases across the text as a whole; the text opposite is over 18,000 words long, and the software can comfortably handle an entire novel on one screen.
In the example opposite, the keywords occur only in a few parts of the text, rather than being distributed throughout it. There is also a degree of symmetry, with each keyword cluster occurring in turn, and very little intermingling of the two keywords within a section of text.
This visual approach makes it easy for the reader to handle texts easily for various purposes, as in the examples below, from our work.
Finding relevant documents online, including ones in foreign languages that are likely to be worth translating
Comparing texts, in textual criticism: A comparison of nativity themes in the four New Testament gospels
Seeing structures in texts: Mentions of witches and sleep in Macbeth
Finding unusual topics: A partial solution to the Boolean NOT problem in online search