Hyde & Rugg:
We solve hard problems
Hyde & Rugg:
We solve hard problems
Representations are tools for thought that make it possible to handle problems that would otherwise be difficult or impossible. A familiar example is using written numbers to perform calculations that people could not handle via mental arithmetic.
We use a range of representations. Although most of the ones we have worked with are visual, we’ve also examined forms of systematic representation across a range of senses.
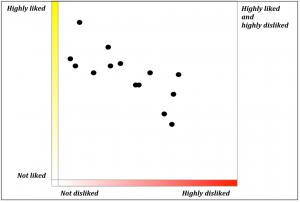
The example below shows a representation that we often use. It shows liking and disliking as two separate scales, making it easy to establish whether something evokes strong mixed feelings (top right corner) or indifference (bottom left) etc. This plot shows feedback from users on an early version of a software design.
Some fields where different representations give new insights (links to our WordPress blog)
Liking, disliking and aesthetics: Treating e.g. ugliness and attractiveness as separate concepts, not opposites
Visually representing hostility and reconciliation within conversations: Clearer insights into the dynamics
Crisp and fuzzy categorisation: Better ways of handling problematic cases
Visualising complexity: Making it easier to understand where the real complications lie
Representing lesson structure graphically: Showing the underlying structure of a text via images
Representing argumentation via diagrams: Showing the underlying structure of systematic use of evidence
Visualising gendered language: A visual representation shows features that would be missed by content analysis