
Hyde & Rugg:
We solve hard problems
Hyde & Rugg:
We solve hard problems
A common way of analysing texts is to use content analysis of the type shown schematically below, where terms are aggregated in successive steps, to quantify their frequencies.
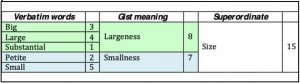
In this example, the process starts with counting the exact words that occur in the transcripts; for instance, big appears three times, and large occurs 4 times, with substantial occurring once. The next step is to lump together terms judged to have the same meaning (gist). In this case, big, large and substantial are judged to have the same meaning of relating to largeness, and are lumped together, giving a total of 8 occurrences for this category. The next step is to lump together gist terms which have related but not identical meanings (superordinate). In this example, largeness and smallness both involve size, so these gist terms are lumped together, giving a total of 15 mentions of terms relating to size.
This approach is useful for basic quantitative analysis, but is best viewed as one tool among many. For instance, this approach can be combined with card sorts, where the card sorts identify concepts that are important to the relevant participants, and the content analysis then finds how many of those concepts are present in the text.
It can also be combined with laddering, to find participants’ opinions about which terms actually are related to each other, and in which ways.
There are also more visual approaches. One example is using causal graphs that trace the causal assertions made within a text (e.g. Axelrod’s Structures of Decision, on reasoning by political decision-makers). Another is using geographical maps to show which locations are mentioned within a text and how often they occur (e.g. Moretti’s Graphs, Nets, Trees).
Similarly, it is possible to show the locations of terms within texts, as in the Search Visualiser images opposite, showing distribution of gendered pronouns within a Shakespeare play. These visual approaches have the advantage of showing causal information and spatial information, as well as frequencies.
The pair of images below show another way of analysing texts. We used our Search Visualiser software to show where gendered pronouns appeared in Shakespeare’s Macbeth. Male pronouns (he, him and his) occur frequently throughout the play. Female pronouns (she, her) occur sparsely through most of the play, but are much more frequent in a section near the end of the play, where Lady Macbeth dies.
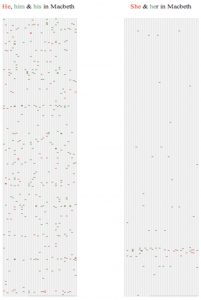
This representation shows not only the relative frequencies of the various terms within the text, but also their distribution, in a way that enables the analysis of large texts swiftly and easily.